Refund Amount, Cancellation Timing, and the Decision to Cancel a Practical Driving Test
A controlled behavioural experiment with the Department for Transport and DVSA.

About Project
- Role
- Behavioural researcher
- Context
- MSc Human Computer Interaction dissertation, UCL Interaction Centre, in partnership with the Department for Transport and the Driver and Vehicle Standards Agency.
- Timeline
- 5 months
- Methods
- Controlled online experiment, 4 by 4 mixed factorial design, N = 200. Scenario based measurement. ANOVA, ordinal regression, mixed effects models, equivalence testing.
- Tools
- Gorilla Experiment Builder, Python (pandas, statsmodels, scipy), matplotlib.
The problem
In May 2026 the median wait for a practical driving test in Great Britain was 9.7 weeks. In some London and West Midlands centres it was over 20.
DVSA has been adding capacity for years. Nearly a quarter of a million extra tests in twelve months, examiner numbers at their highest since 2019. The queue is still long. So the interesting question is not only how to create more slots, but how to stop wasting the ones that already exist.
The current scenario is this: cancel your test with ten or more working days of notice and you get your £62 back. Cancel inside that window and you lose all of it. Which means that once you cross the deadline, formally cancelling and silently not turning up cost you exactly the same amount: everything.
One of those outcomes releases a slot for another learner. The other wastes it. The current rule gives candidates no reason to pick the useful one.
Theoretical background
Sunk costs, loss aversion and mental accounting. Three accounts predict that a larger refund should make cancellation more likely. Sunk-cost reasoning suggests that people resist abandoning money and effort already invested. Loss aversion suggests that forfeiting a paid-for appointment feels like a loss, making cancellation harder. Mental accounting suggests that people track the test fee as a separate expense: a partial refund lets them recover some of that outlay rather than close the account at a total loss (Arkes & Blumer, 1985; Kahneman & Tversky, 1979; Thaler, 1985, 1999).
These explanations predict the same direction of effect, but propose different mechanisms. Varying refund amount alone can test their shared prediction; it cannot establish which explanation is responsible.
Present bias, procrastination and inertia. Timing offers a separate prediction. As the test approaches, its immediate costs and benefits become more salient. Cancelling also requires an active step, while keeping the booking is the default. Present bias and the tendency to defer effort therefore suggest that people may become less willing to release a slot as the date draws near (Laibson, 1997; O’Donoghue & Rabin, 1999; Samuelson & Zeckhauser, 1988).
Empirical background
Missed appointments in public services. In two randomised trials at a UK hospital, Hallsworth and colleagues (2015) found that including the cost of a missed appointment in text reminders reduced non-attendance. This supports the idea that making financial consequences salient can change behaviour. For driving tests, it motivated studying the decision to release a slot among candidates who were still undecided.
Refunds and recovered capacity. Xie and Gerstner (2007) showed that refunding cancelled reservations can benefit firms because released capacity can be sold again. A driving-test slot can similarly be offered to another learner. But commercial evidence does not establish the right refund amount or notice period for DVSA: the public-service objective is to deliver more tests, rather than maximise fee revenue.
What scenario studies can tell us. Vignettes allow refund amount and timing to vary independently under controlled conditions. Their limitation is that stated intentions can differ from real behaviour, particularly when inertia and present bias matter at the moment of action. This study could therefore inform the direction and relative size of the effects, while a field trial would be needed to establish actual cancellations and recovered slots.
The gap this study addresses. Under the refund rule described in the dissertation, more notice and more money back arrive together. That makes their separate effects difficult to identify. The experiment varied them independently to examine which mattered more in a setting with a scarce appointment, a modest fee and high personal stakes.

Designing the study
Two hundred UK adults imagined booking and paying £62 for their first practical test, taking the only slot they could find, still having lessons, and being genuinely unsure whether they were ready. They rated how likely they would be to cancel, on a scale of one to seven.
Refund was varied between participants at four levels: nothing, £15, £31 and the full £62. These map onto nothing, roughly a quarter, half and all of the real fee.
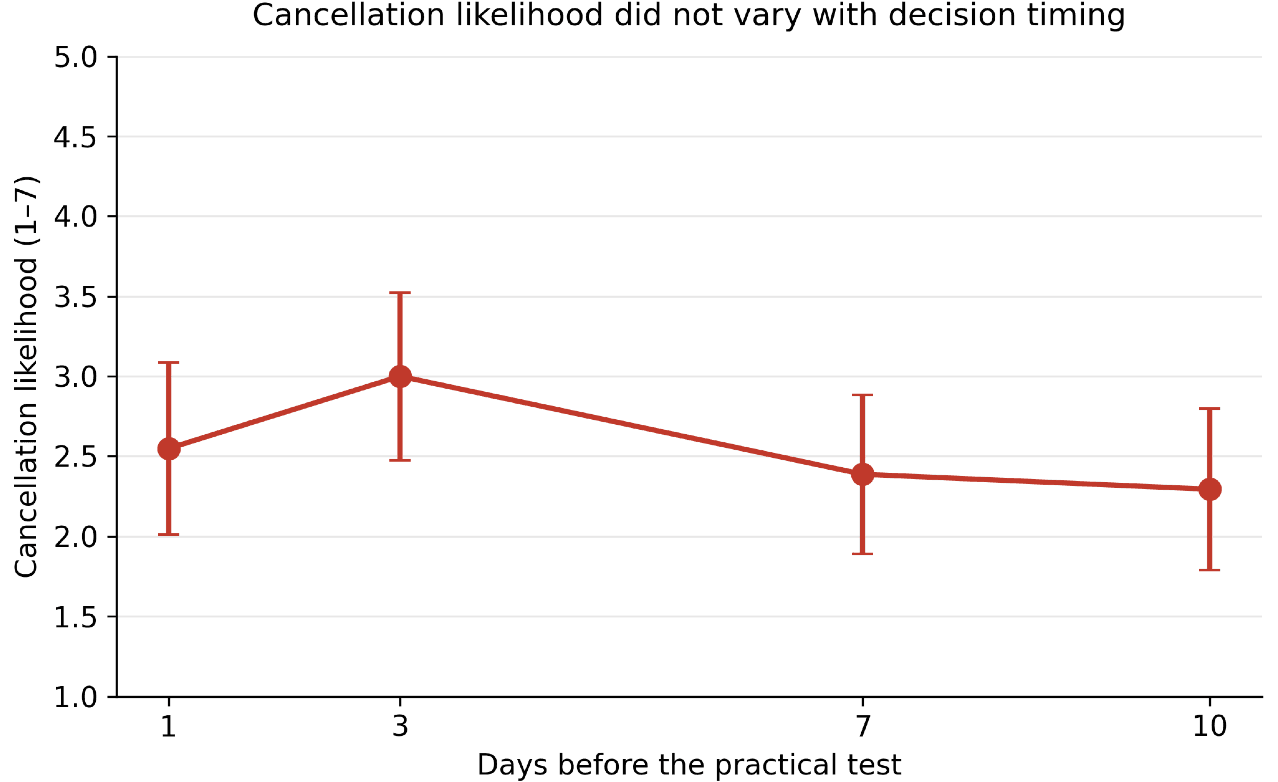
Timing was varied within each participant. Everyone made a first decision at five days before the test, then a second at an interval of 1, 3, 7 or 10 days.
What I found
Refund moves people, and the effect is large
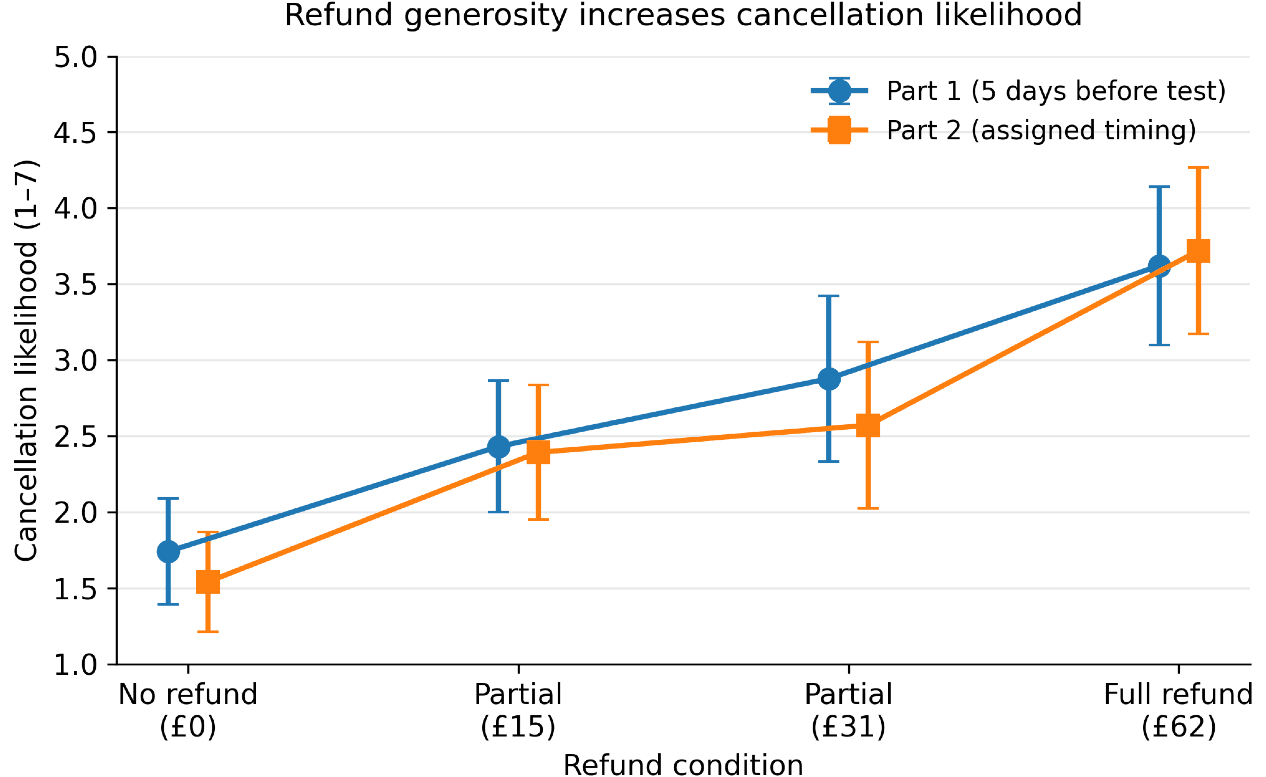
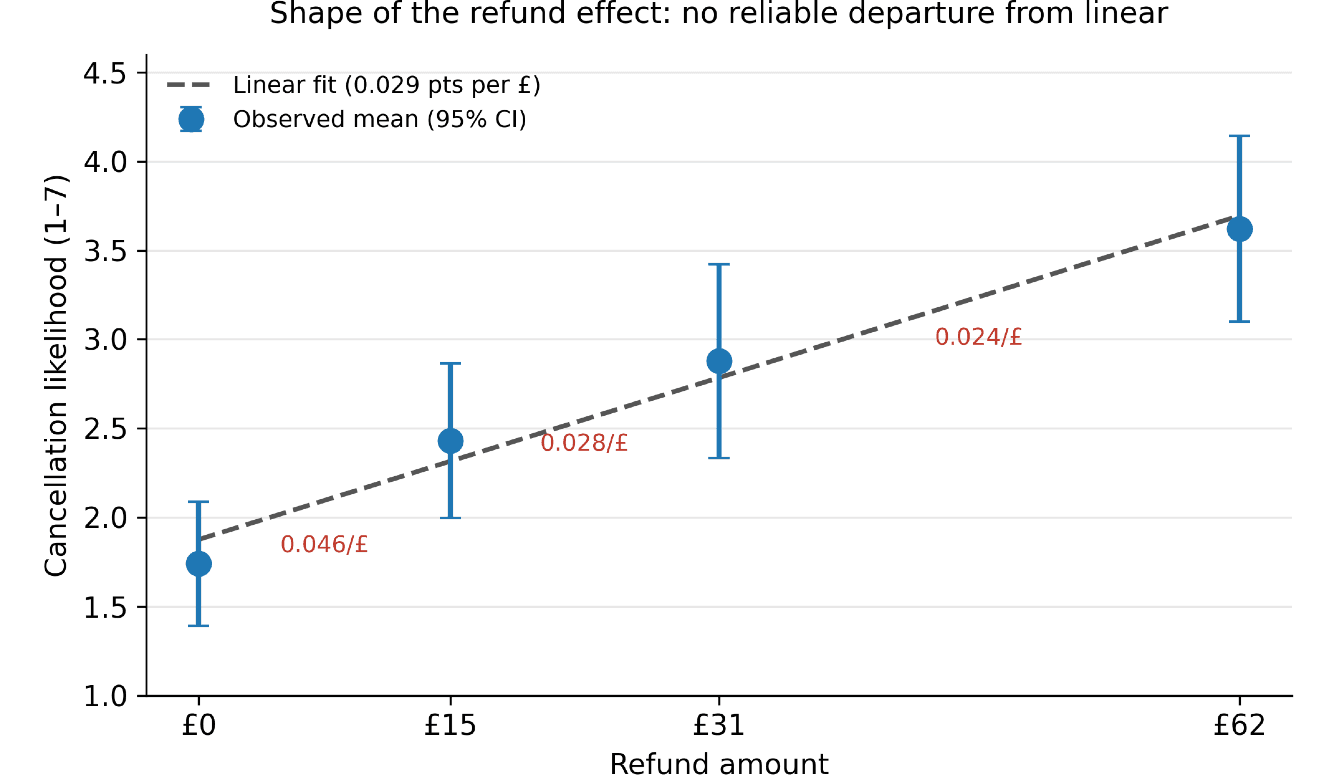
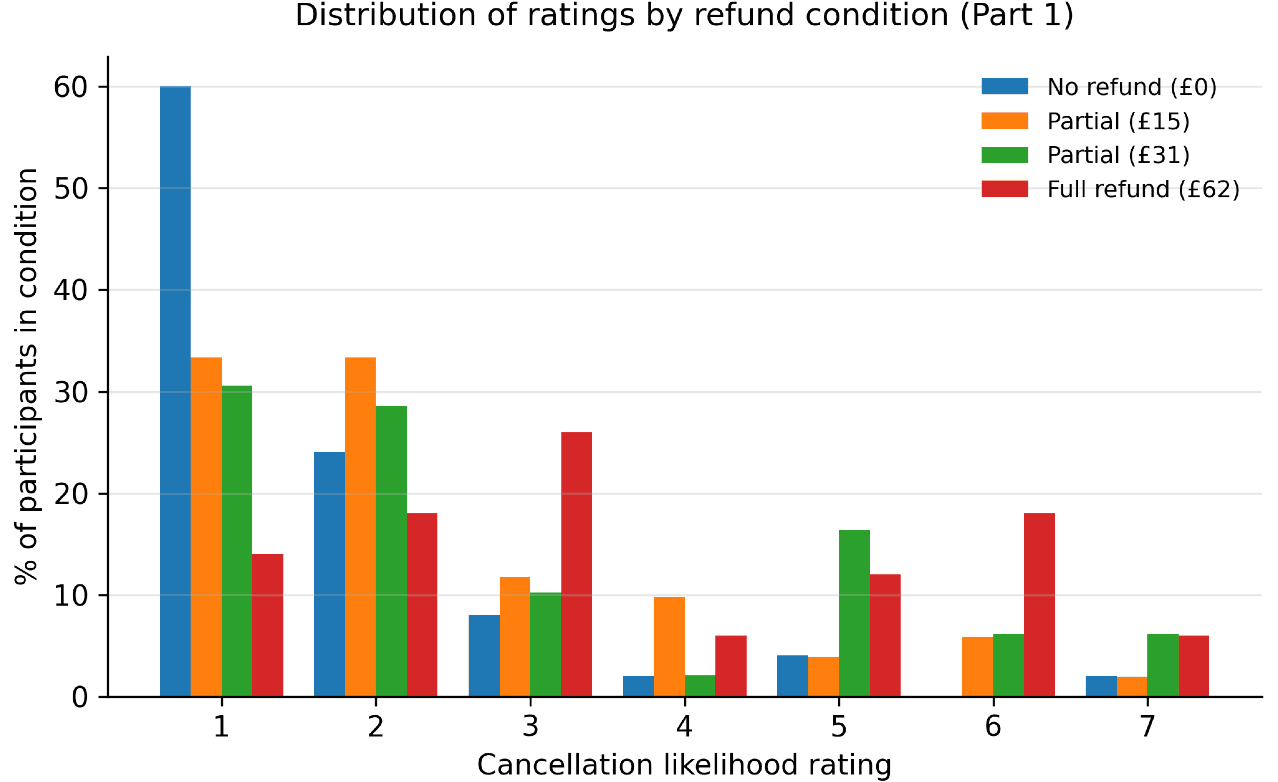
Willingness to cancel rose steadily with the refund, from a mean of 1.74 with nothing back to 3.62 with the whole fee returned. That is a difference of 1.88 scale points, a large effect (d = 1.17, p < .001).
It held up under pressure. The same gradient reappeared when the same people rated the identical refund a second time at a different notice period. It survived adjustment for age, sex and licence status. This is the finding DVSA can act on.
Notice period did nothing
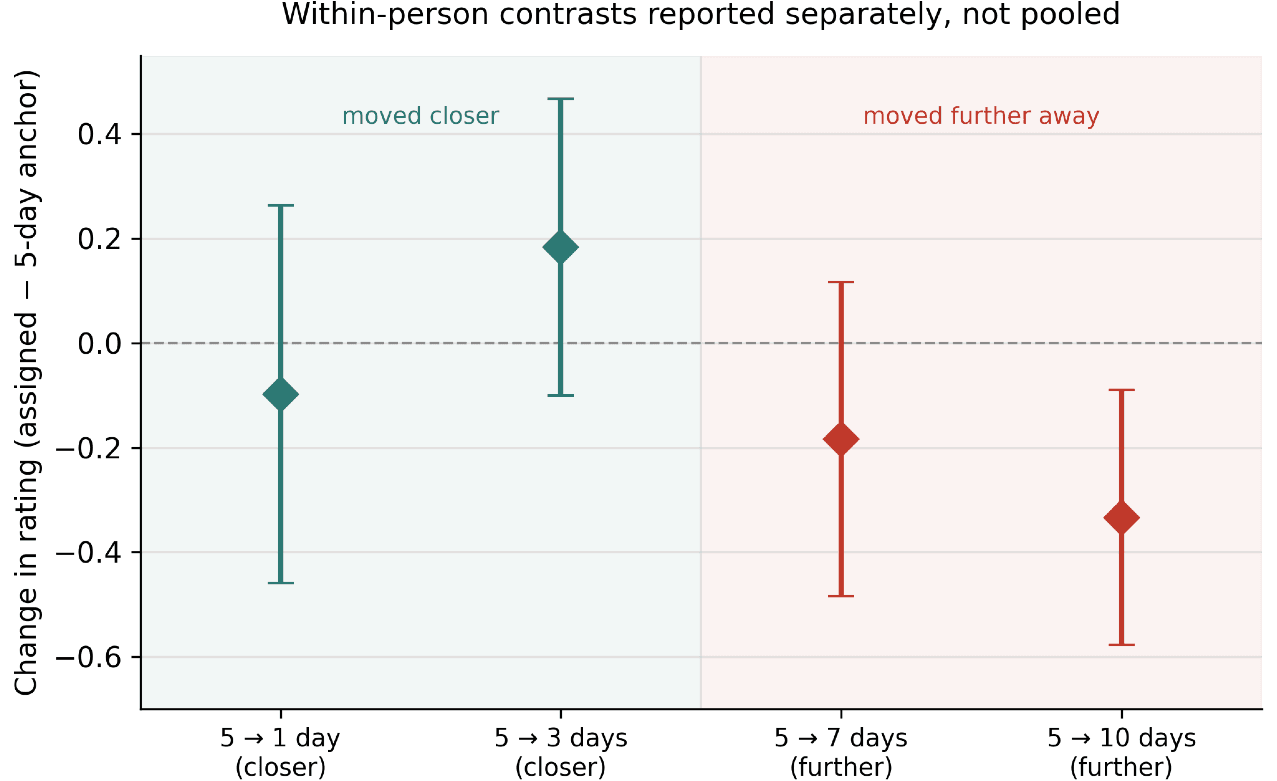
Timing had no reliable effect. This was the hypothesis I expected to confirm, and it failed.
Rather than report a bare null, I ran equivalence tests, which let you put a bound on what you can rule out. Effects larger than one scale point can be excluded. Effects around half a point cannot. That is a more useful statement for a policy team than "no significant difference", because it tells them how small the thing they are not seeing must be.
There was also an exploratory signal running opposite to prediction: the only reliable movement was among people whose decision moved further from the test, and their willingness to cancel went down. If that replicates, it suggests a refund would do most work inside the final week, which is precisely where current policy offers nothing. I flagged it as a hypothesis for direct testing, not a finding.
A ceiling that matters more than either
Every single condition sat at or below the midpoint of the scale. Even with the whole £62 returned, only 42 percent of participants leaned towards cancelling.
This is the number I put in front of the client, because it sets realistic expectations. Refunds move intentions reliably, but money is not the main thing keeping people attached to an appointment they are unsure about. A refund policy should be expected to recover a modest share of slots, not to transform behaviour. It was more useful to say that clearly than to let anyone discover it after a rollout.
Thanks for reading.